
Multi-site Zabbix monitoring platform: Nine production sites, one dashboard
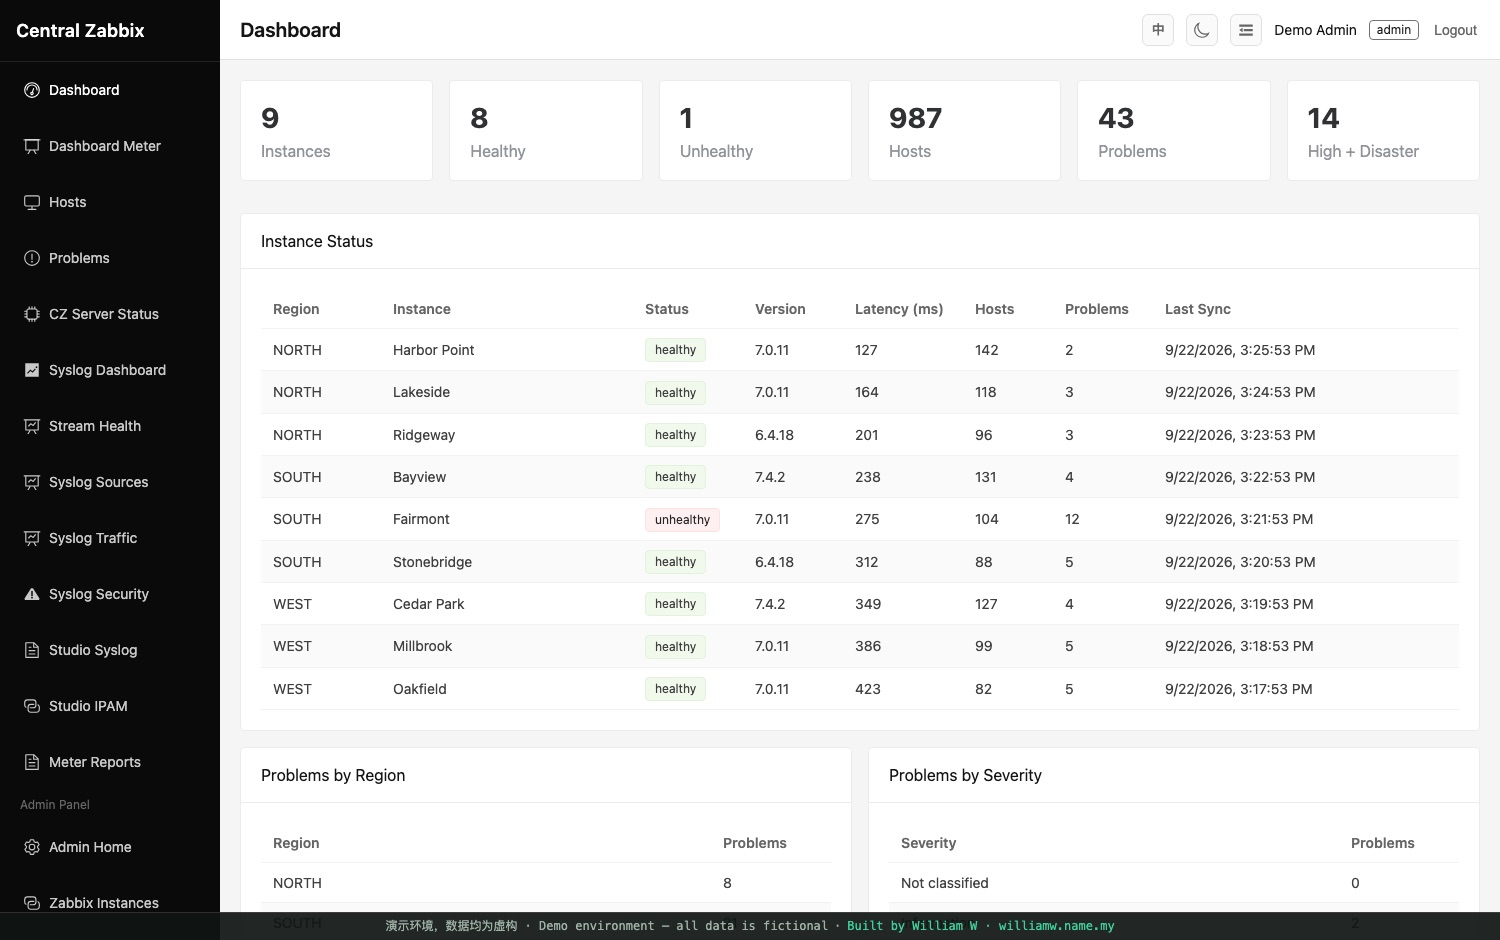
A custom monitoring platform that aggregates nine production Zabbix sites (running three different Zabbix versions) into one dashboard, ingests firewall logs into ClickHouse for instant search across hundreds of millions of entries, and pushes alert cards to enterprise chat that turn green by themselves when the problem recovers.
Updated
In production · anonymised demo
Built and operated in production for a company that is deliberately not named. The demo you can open is the same system, sanitised: real data and names removed, everything else as deployed.
FairmontSOUTH
12 problems
- Hosts
- 104
- Latency
- 275 ms
UnhealthyDemo data
The starting point
The operations team ran nine independent Zabbix installations across client sites: three different Zabbix versions, nine logins, nine dashboards. Checking overall health meant logging into each one; firewall logs sat on devices where searching them was slow and painful; and alerts arrived as plain texts nobody could tell apart from resolved ones.
What was built
- One dashboard aggregating hosts, problems and health across all nine sites, with per-site fault isolation and automatic failover to backup API endpoints
- Compatibility layer spanning Zabbix 6.4 / 7.0 / 7.4 API differences; sites upgrade on their own schedule
- Firewall syslog pipeline into ClickHouse: hundreds of millions of entries, searchable in seconds, with traffic/UTM/event analytics
- Alert cards in enterprise chat that update themselves (turning green on recovery), plus scheduled chart reports
- Zabbix dashboard replication with six months of interactive history and about 3.5 years of hourly archive
- A read-only AI assistant: ask "which hosts are down at site A?" in chat and get the answer with data cards
Tech stack
- Vue 3
- FastAPI
- PostgreSQL
- ClickHouse
- Docker
- AI / MCP
What it changed
- Daily operations moved from nine logins to one screen; cross-site health is visible at a glance
- Firewall log questions that used to mean SSH-ing into devices are now a search box with sub-second answers
- Resolved alerts identify themselves; the team stops re-checking incidents that already recovered
- Non-technical colleagues get monitoring answers from the AI assistant without learning Zabbix
Common questions
Can this work with our existing Zabbix installations?
Yes, that is the whole point. The platform connects to your existing Zabbix servers over their API (versions 6.4 through 7.4 are handled), so nothing about your current monitoring needs to be rebuilt or migrated.
We use WhatsApp / Telegram instead of Lark. Can alerts go there?
The alert pipeline is channel-agnostic: the delivered system pushes to Lark, and adding WhatsApp (official API), Telegram or Teams is an integration phase, not a redesign.
How long does a monitoring platform like this take?
The first useful phase (multi-site aggregation with one dashboard and chat alerts) is weeks of work. Log analytics, dashboard replication and the AI assistant were added as later milestones on the same platform.